Every brand needs to understand where they sit in the competitive landscape. Companies regularly need to gauge product strengths and weaknesses against the other brands in the marketplace and make strategic decisions based on that information. Your product may be selling but WHY is it selling? What do customers like? Do they feel passionate about your product or is it simply a good deal?
In this example we’ll show you how the Metametrix approach reveals how brands compare on the functions versus Values and Emotions, resulting in a deeper insight to competitive analysis.
Step 1: The Basics
For this study, we evaluated smart watches comparing four products from popular brands of Apple, Fitbit, Garmin, and Samsung. We analyzed Amazon reviews that were written between October of 2019 and May of 2022.
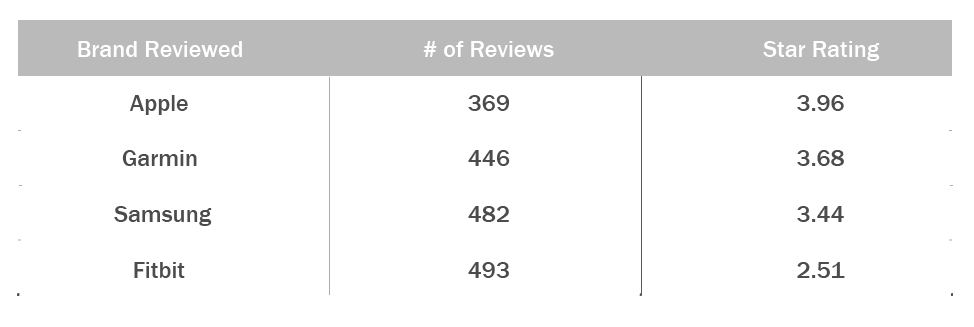
In this basic summary you can see that the highest overall rated watch is the Apple Watch, with Fitbit being the lowest rated watch. While this is useful information, it begs the question “Why”? What’s driving these product ratings? To answer that question, we ran all 1,790 product reviews through Metametrix and analyzed for the results below.
Step 2: Key Themes
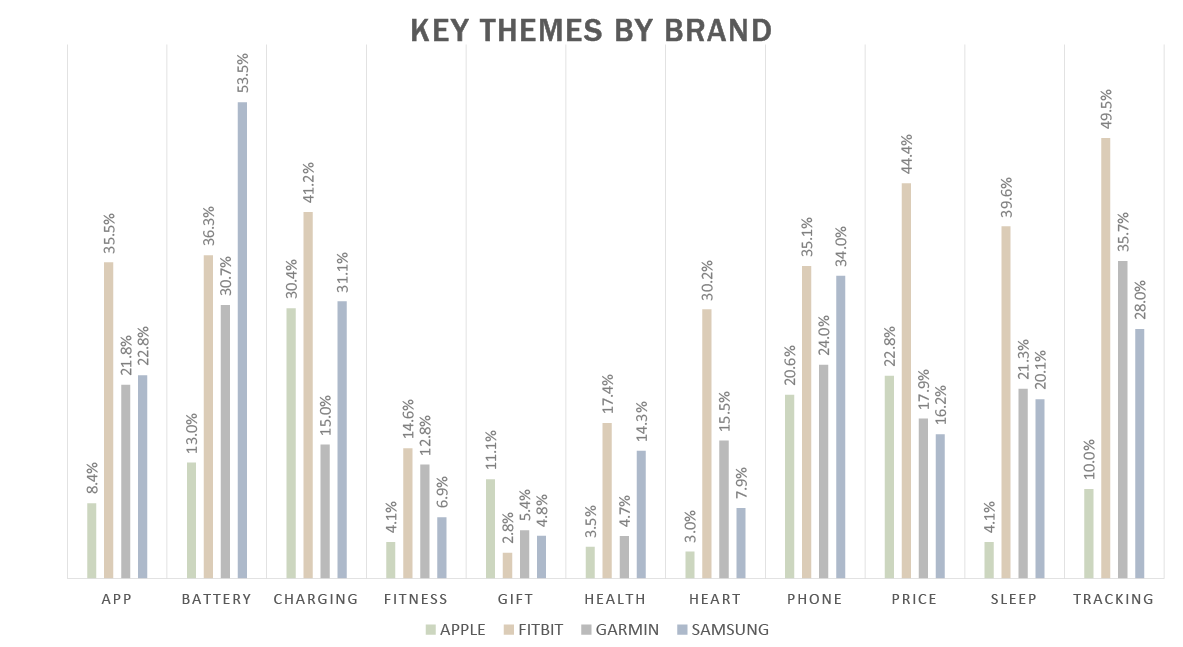
First, we want to know what matters to customers. Our analysis identifies concepts, ideas, non-obvious words we distill down into a finite number of Key Themes present in the reviews and what customers are talking about by brand. For example, 8.4% of Apple reviews have the Key Theme APP while over 35% of Fitbit reviews are related to the Key Theme APP. In this analysis most of the Key Themes are functional benefits.
Brand Observations
– Across the board, Apple is not winning on Key Themes, or functionality, except for CHARGING, GIFT and PRICE. GIFT is more than double the next brand which is Garmin.
– Fitbit is a standout, scoring highest on several Key Themes and functional benefits.
– Garmin is right in the middle and is the least present on any Key Theme.
– Samsung is most present on one Key Theme – BATTERY.
Step 3: Metametrix Map
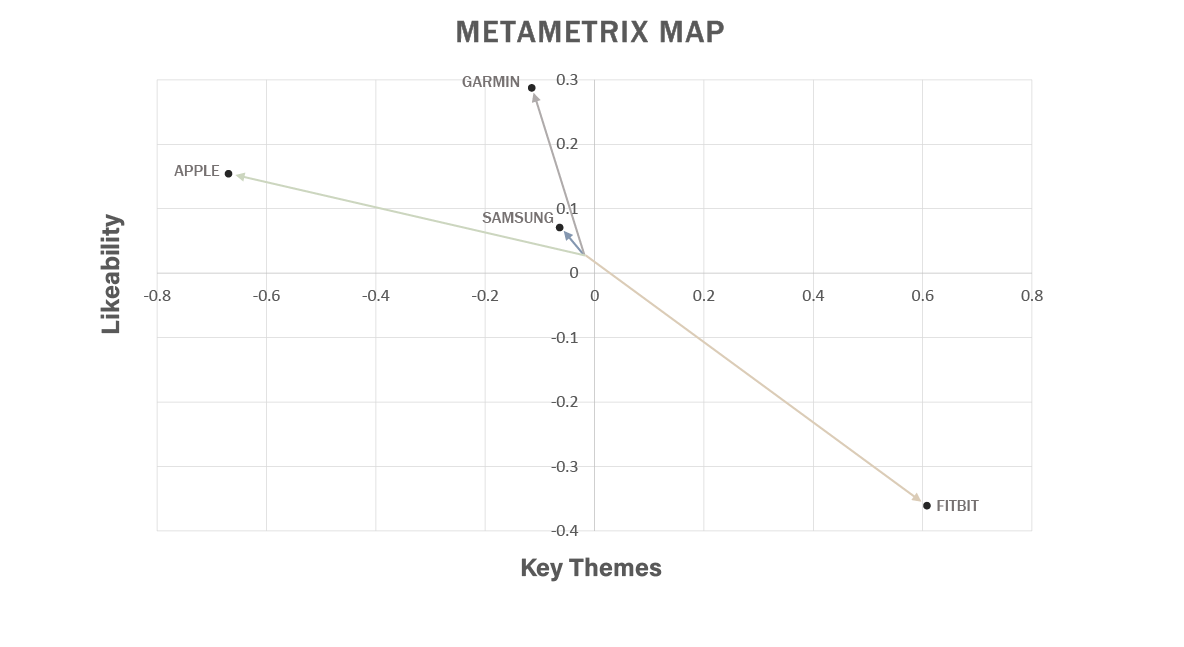
To see how the brands stack up against each other we conducted another analysis to reveal two primary factors Key Themes, like those mentioned above, and Likeability, which is looking at star ratings, sentiment, etc.
Brand Observations
– Apple is the highest star-rated product and second most “likeable” behind Garmin, and interestingly it ranks lowest on Key Themes. Consumers understand that it has features, but Apple buyers do not really call them out.
– Fitbit is on the other end of the spectrum. It is the lowest with regards to likeability, but highest with respect to Key Themes. Comments from Fitbit buyers are very focused on the specific Key Themes. They tend to mention Key Themes more often whether it be tracking steps, monitoring heart rate, etc.
– Garmin is uniquely positioned where it is not too heavy on Key Themes but very good with respect to likeability which is tied to price and value.
Step 4: Emotions and Values clarify brand differentiation
Emotions By Brand: Examining the Top 10 emotions detected in the reviews tells us more about what the customers were feeling about the products.
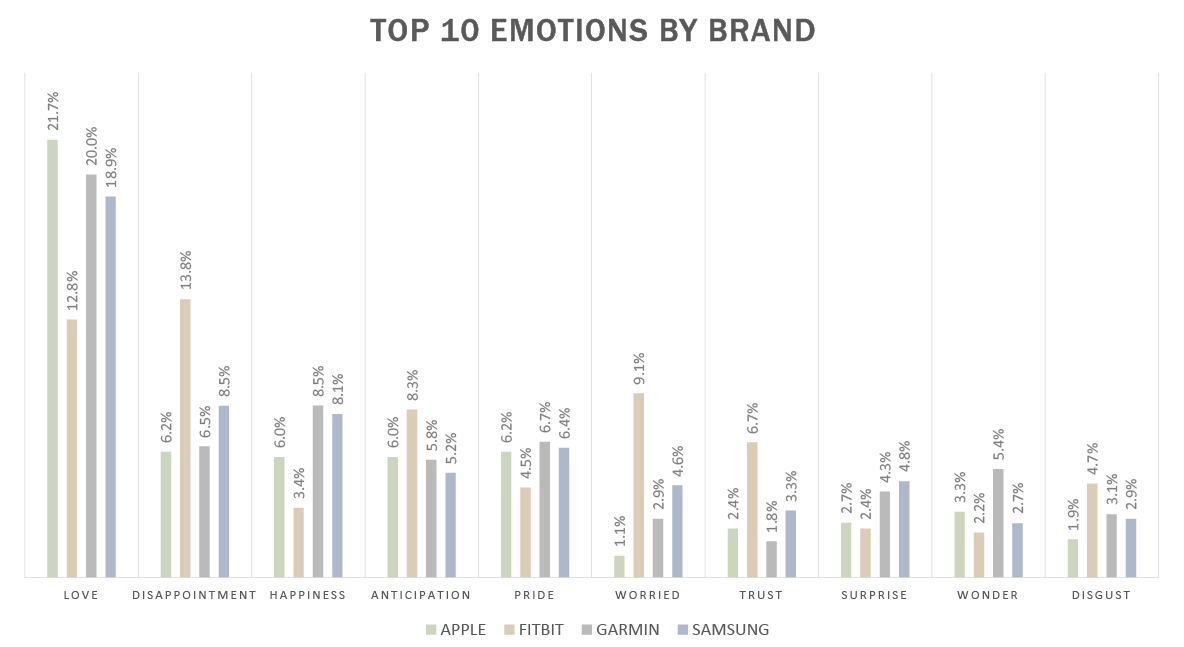
Brand Observations
– The most present emotion is ‘Love,’ not a surprise for customer reviews but it helps to compare brands on this top emotion. Apple is the product with the most reviews with Love and 21.7%, Garmin has 20%, Samsung has 18.9% and Fitbit at 12.8%
– While Love rules for Apple it is the product with the least emotions “Disappointment’ (6.2%), ’Worried’ (1.1%), and ‘Disgust’ (1.9%). This is again not surprising as it is the highest rated product.
– For Fitbit, the most present emotion is ‘Disappointment’ (13.8%), followed by ‘Love’ (12.8%) and then ‘Worried’ (8.3%) and then ‘Trust’ (6.7%).
To really understand what some of these emotions mean for a brand let’s dig a little deeper on a few of the more negative emotions.
– Worried was associated with the smart watch working the way they expected.
– Disappointed came up related to battery life and charging issues.
Values by Brand
Analyzing for the Top 10 most present Values in the reviews and how that broke out by brand tells us what values were behind the experiences customers had with the products.
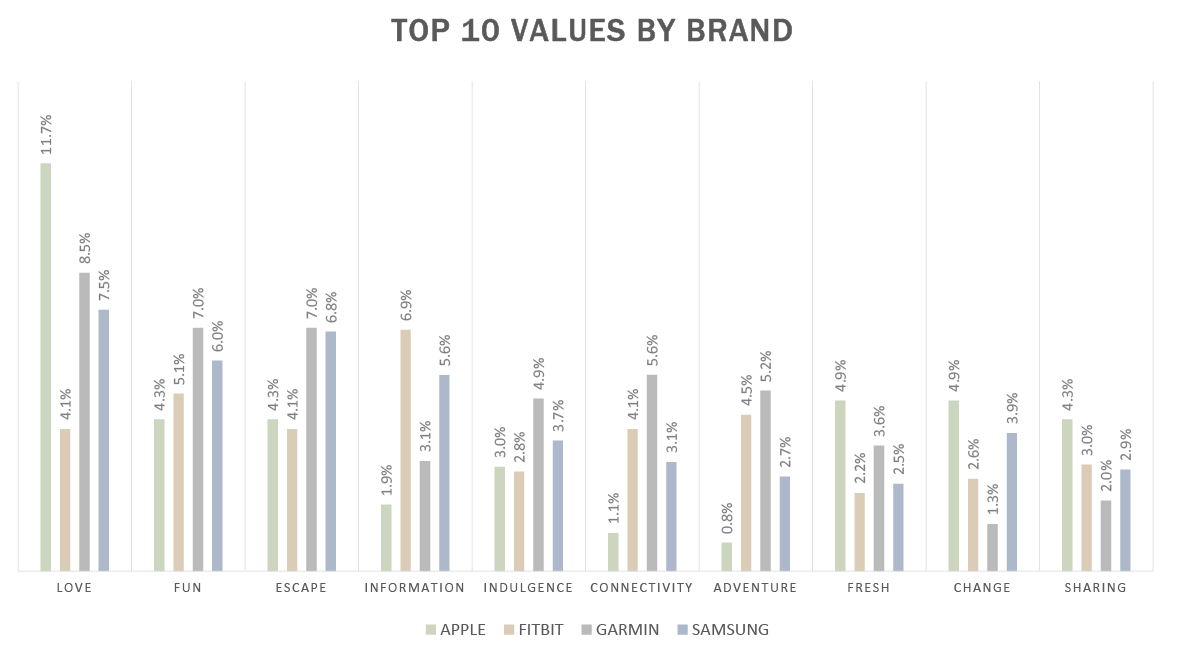
Brand Observations
– Much like we saw with Emotions, the Top Value is ‘Love’ and it is highest for Apple (11.7%), followed by Garmin (8.5%) and Samsung (7.5%) with Fitbit only having 4.1% of reviews coming back with the Top value of ‘Love’.
o *Note: The Value of Love is the aspiration or goal of having and maintaining love in your life. Compared to the Emotion or feeling of Love and affection or intense “liking.”
– It is interesting that the next two most present Values of ‘Fun’ and ‘Escape’ are highest for Garmin. This may be related to its positioning and focus on the outdoors. Garmin also ranks highest on Connectivity and Adventure.
– Fitbit is highest on the Value ‘Information’ which makes sense when you consider that Fitbit reviews are heavy on the Key Themes of the product.
– Samsung is once again kind of a mixed bag with no real dominance on any particular Value.
Summary
Ahead of a more complex and costly study, customer reviews offer insights to inform your process. No survey design, no weeks long moderated group, no data costs. Instead, a quick analysis of how customers are responding to your products versus your competitors.
– Learn more about where your brand compares to competitors by evaluating functional benefits versus Values and Emotions
o Evaluate how your brand scored on the functional benefits or Key Themes
o Analyze how customers feel about your products with Values and Emotions.
