Metametrix: Truth Serum For Big Data
The world is generating valuable data every day
Web content like news and blogs, social media, customer reviews, survey open ends. These data are an untapped gold mine of consumer insights. The challenge is how to coax the meaning from it effectively and efficiently.
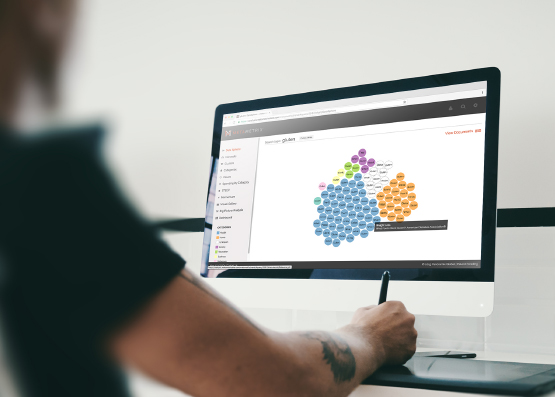
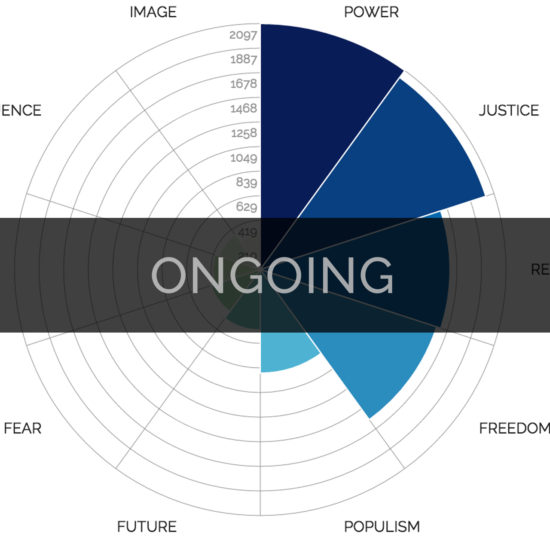
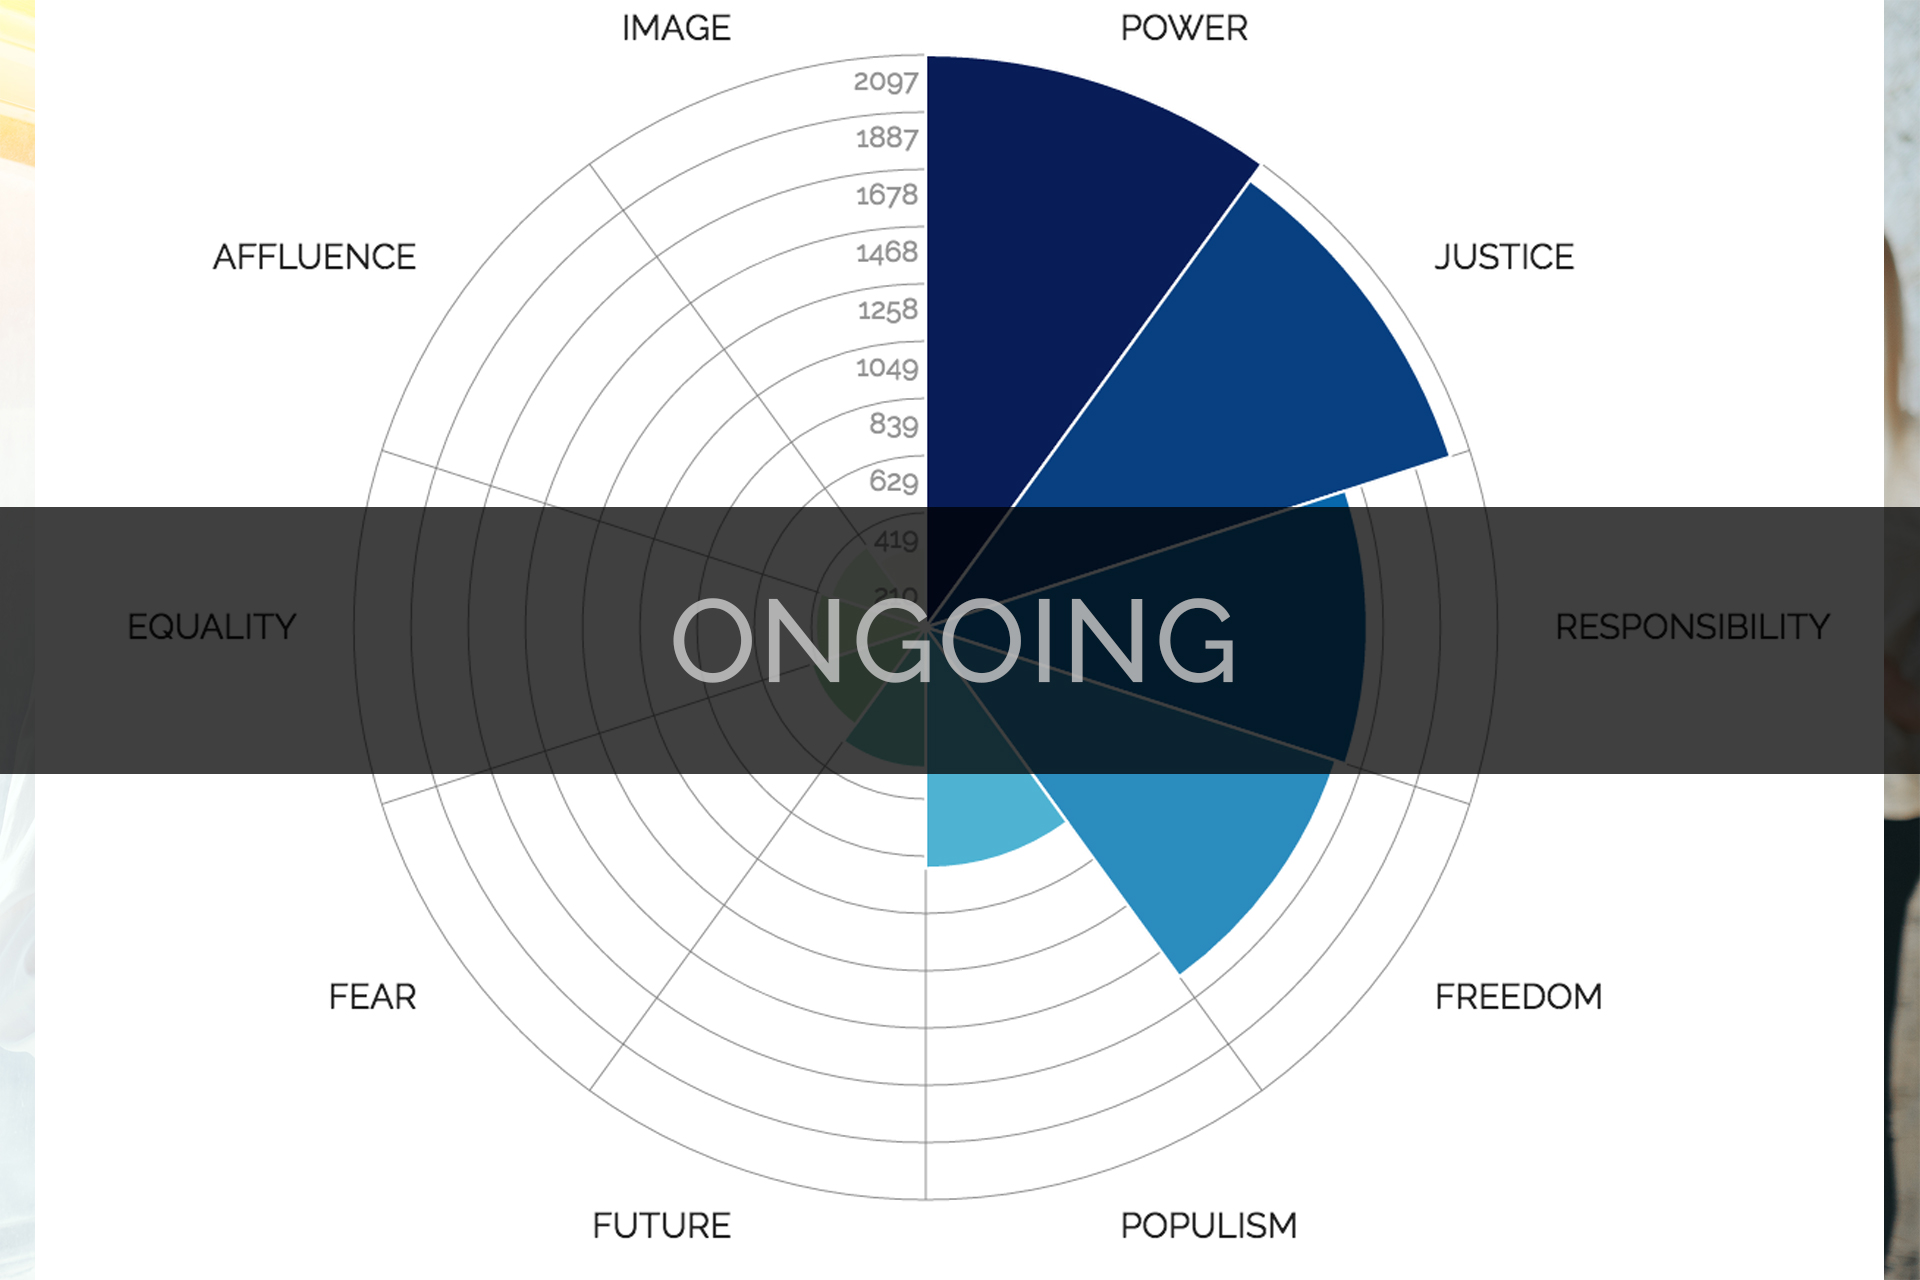
Metametrix meets that challenge with instant analysis revealing the trifecta of insights. Our proprietary technology detects values, emotions, and sentiment in the data, untangling the complexity of WHY we do what we do. Without these behavioral signals an incomplete analysis is produced.
In addition, the Metametrix platform lets users upload their own data for instant analysis. And if you’ve always wanted a look behind the data viz, one click lets you download The Data Mine, an extract to analyze and filter your data or public data for an unparalleled level of actionable customer insight—all from your desktop.
We are a text analytic insights platform with three solutions
SEARCH
Explore topics, compare brands, investigate innovations, evaluate customer reviews. Use Metametrix to search and analyze whatever exists on the web—people, places, things—generating insights and ideas on your issues and challenges.
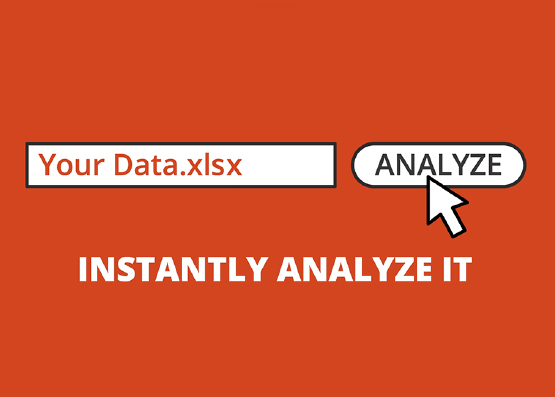
UPLOAD A FILE
Save time and focus your insights. With Metametrix, you can upload a file of any unstructured text–social media, reviews, survey verbatims, call-center comments—for instant analysis to reveal themes and meaning hidden in the data right from your desktop.
THE DATA MINE
You have lots of data. We have the solution. The Data Mine is an instantly downloadable, customizable big data extract that lets you access, analyze, filter, and mine your data or public data for an unparalleled level of actionable customer insight.
Social Media
Category: Outdoor Recreation
Challenge: Social media analysis needed to be more actionable
Solution: Created a stronger customer communication strategy and sparked a new deliverable for the agency
Call Center Comments
Category: Personal Care
Challenge: How to explain customer perspective and declining sales heading into global brand meeting
Solution: Identified a significant problem causing the decline in sales and the strength and specifics of a new product opportunity
Online Community
Category: Retail
Challenge: How to determine if the brand strategy, disrupted by global pandemic, was still relevant
Solution: Confirmed the strategy but uncovered deeper insights and nuances between segments for precise targeted messaging
Public Reviews
Category: CPG
Challenge: Gauge messaging for high-stakes holiday period
Solution: Added depth and meaning to the strategy, bringing the customer experience to life
This DIY option lets you analyze web data or upload your own data, right from your desktop, to instantly sort through the analysis for the dominant themes, values and emotions.
View Article
Our clients are researchers, marketers, product developer, insights specialist, planners, and innovators. We serve anyone who needs fresh data, big trends, consumer insights and broad cultural perspective. For more information, check out our About Us and FAQs.
View Article
- Turn cultural knowledge into your competitive edge
- Gain insights into the values driving consumer behavior
- Identify new innovation opportunities
- Add data-driven insights expertise without adding team members!
View Article
Block Content
Najlepsze bonusy i sloty w polskim kasynie online – sprawdź ofertę Najlepsze bonusy i sloty w polskim kasynie online – sprawdź ofertę Polskie kasyna online przeżywają prawdziwy rozkwit, a gracze mogą cieszyć się ekscytującymi promocjami…
Odkryj Najlepsze Bonusy i Sloty w Polskim Kasynie Online Odkryj Najlepsze Bonusy i Sloty w Polskim Kasynie Online Polskie kasyna online przeżywają prawdziwy rozkwit, oferując graczom niezapomniane wrażenia i szansę na spektakularne wygrane. Jeśli szukasz…
Polskie Kasyno Online – Najlepsze Bonusy i Gry Sloty Polskie Kasyno Online – Najlepsze Bonusy i Gry Sloty Polskie kasyna online przeżywają prawdziwy rozkwit, a gracze z Polski mają dziś dostęp do setek emocjonujących gier…
Casino Loyalty Programs for NZ Players: What to Look For Casino Loyalty Programs for NZ Players: What to Look For For New Zealand players, the best online casinos offer more than just a great selection…
Blackjack Strategies Every NZ Player Should Know Blackjack Strategies Every NZ Player Should Know The Foundation: Basic Strategy Blackjack is one of the few casino games where skill genuinely affects your outcome. The well-known basic…
Craps Basics: A New Zealand Player’s Guide Craps Basics: A New Zealand Player’s Guide Craps is often viewed as one of the most intimidating table games in any casino, largely due to the fast pace…


